Opening the ledger: why the numbers must lead
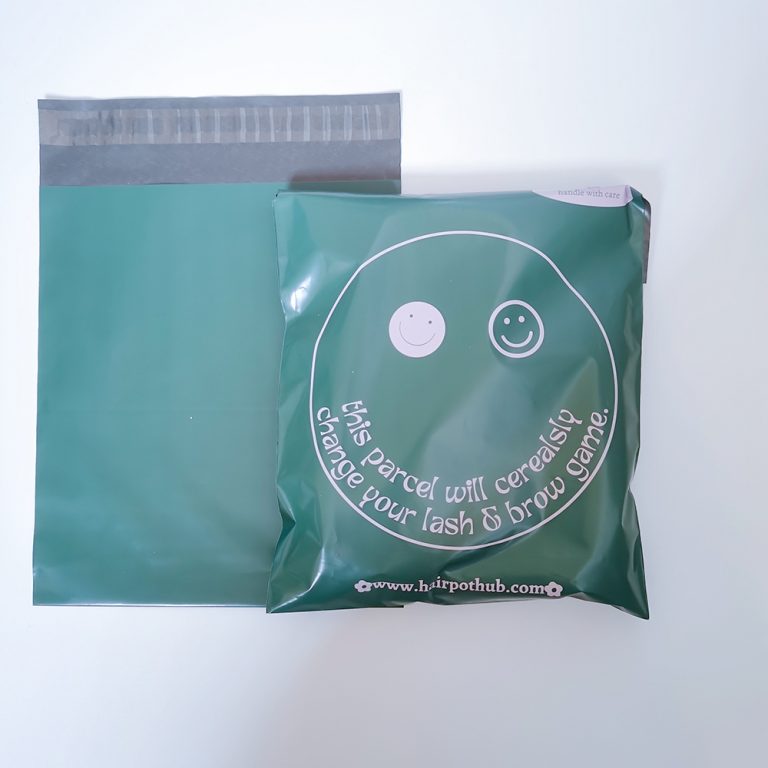
When you compare a lower per-unit price to the cost of handling returns and transit damage, the right choice rarely comes from intuition alone — it needs data. With e-commerce swells such as the roughly 32% rise in U.S. online retail sales in 2020 (U.S. Census Bureau) still shaping fulfillment volumes, a quiet increase in damaged parcels can move margins overnight. Start with a simple test order of custom printed poly mailers and log damage rates, then translate those rates into dollars. This is the only honest way to see how a cheaper poly mailer or one with added features like handles and a tear strip performs in the real world.
Data-driven framing: what to measure first
Focus on three measurable inputs: unit cost, damage/return rate, and cost-per-claim (including reverse logistics and lost product). From those you can compute a per-order expected loss and compare it to the premium for added protection or convenience features — for instance, reinforced handles or a gusset that reduces pressure on corners. Track these metrics for a representative sample, and use the results to project annual impact. The calm truth: small percentage shifts in damage rates scale quickly when you ship thousands of orders.
Calculating ROI: a practical formula
Keep the math simple and repeatable. A basic ROI check looks like this:
– Incremental cost per unit (premium for handles, heavier film, stronger seal) × annual units shipped = extra spend
– Reduction in damage rate × average claim cost × annual units shipped = saved cost
– If saved cost exceeds extra spend, the upgrade pays back. If not, iterate on material or design — perhaps a thicker CPE film or a different self-seal system — and run the test again. This disciplined approach reveals whether a visually modest change, like adding a handle, actually reduces returns enough to justify the tooling or higher grammage.
Real-world patterns and common findings
Across fulfillment networks, three patterns recur: lighter films save on unit cost but increase puncture or seam failures; printed poly mailer bags with reinforced stress points show fewer handle failures; and inconsistent sealing is often a packing-station issue rather than a material flaw. You’ll see seasonal variance too — holiday surges create more dropped parcels and more claims. — These are not opinions; they’re operational truths reflected in claim logs and QC reports.
Design levers that influence outcome
Some design choices punch above their weight in preserving product value:
- Material thickness and composition (LDPE vs. CPE) — resists punctures differently.
- Handle design and reinforcement — reduces torque on seams during conveyor handling.
- Closure type (self-seal vs. adhesive with flap) and tear strip placement — affects both tamper evidence and return friction.
Testing combinations in pilot runs helps reveal which levers actually move the needle for your SKU mix.
Common mistakes in supplier selection
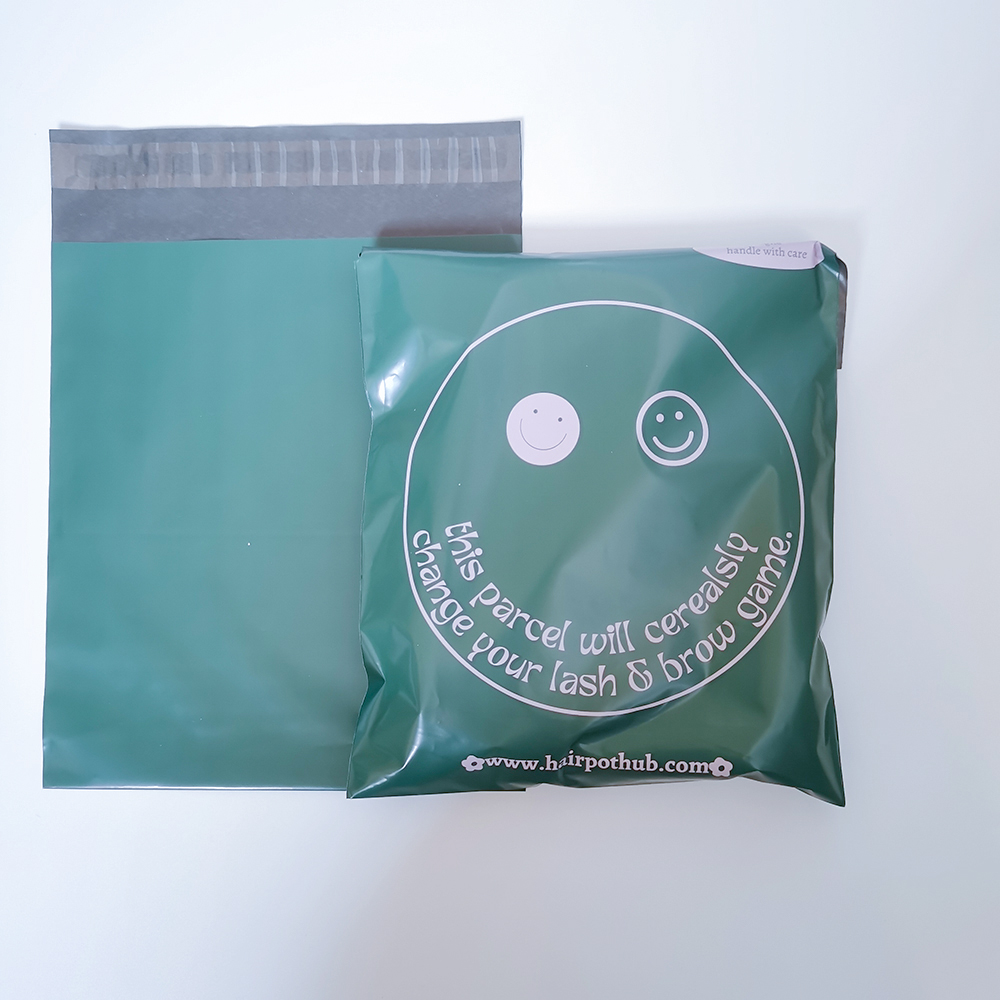
Teams often make three related errors: they focus only on unit price, they neglect to measure pack-line compatibility, and they accept supplier QA claims without independent sampling. A repeatable remedy is to demand first-article samples, run them through your packing line, and measure real damage incidence — not theoretical tolerances. Also evaluate the supplier’s print run capabilities if branding matters: poor CMYK registration can degrade perceived value and increase customer complaints.
When to prioritize cost, and when to prioritize protection
Use a segment-based policy. For low-margin, high-volume SKUs, unit cost often dominates — but only when damage rates are low and predictable. For high-value or fragile items, prioritize reliable protection and consider a slightly higher per-unit spend for features like reinforced handles and multi-layer barrier films. The data will show where the inflection point lies for each product family.
Closing: three golden evaluation metrics
To choose wisely, apply these three metrics consistently:
- Damage Rate Delta — the percentage point change in damage after switching packaging.
- Net Cost per Order — unit cost plus expected claim cost (post-change) divided by orders.
- Operational Fit Score — a simple 1–10 rating for how well the package runs on your line (sealing speed, handle throughput, stacking).
Run short A/B pilots and let these metrics guide procurement — they make the trade-offs visible and manageable. In practice, many brands find that a modest investment in higher-quality printed poly mailer bags reduces returns and protects brand perception enough to justify the cost. —
When numbers and quiet judgment meet, the packaging choice becomes less risky and more strategic; for teams seeking a partner who understands both the data and the craft, WH Packing sits naturally at the center of that conversation. —