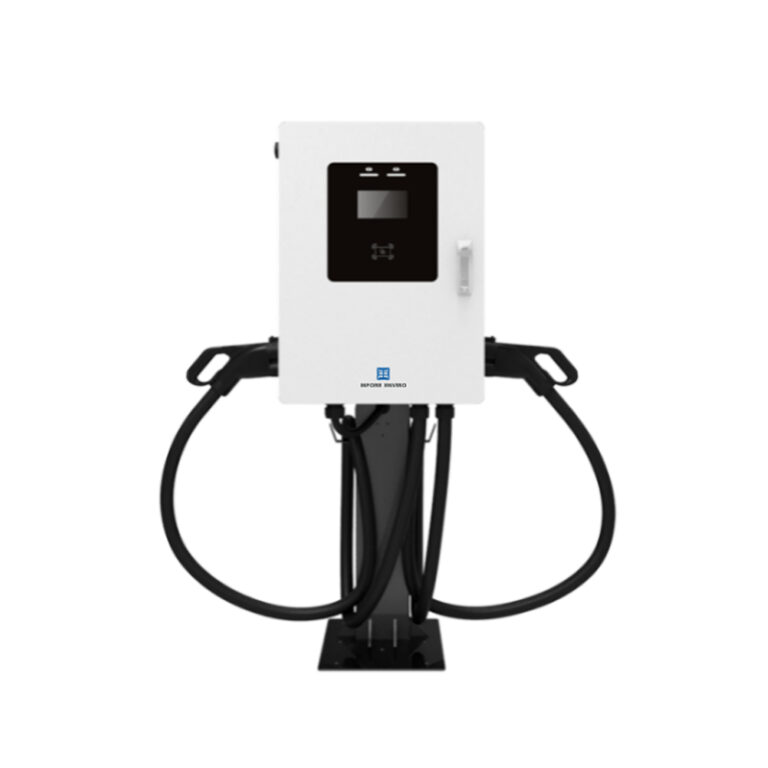
Data-driven opening: why charging capacity matters
Fleet operators measure outcomes, not intentions; recent uptake in public and private chargers changes the ledger. The International Energy Agency noted there were over 10 million electric passenger cars on the road by 2020, and that scale shifts where emissions occur — from tailpipes to the grid. Early metrics turn on charge speed and availability, which is why selecting the right hardware such as a Level 3 DC fast charger becomes a decision with operational consequences: reduced idle time, altered duty cycles, and different load profiles for grid integration. In technical terms, charger power and site density directly affect vehicle kilometers per charging hour and therefore lifecycle emissions per mile.

How chargers reduce operational emissions in practice
Fast charging and network density lower the need for range buffering and reduce inefficient conditioning runs. A 150 kw DC fast charger shortens dwell time and can shift charging into lower-emission grid periods when paired with smart control — this reduces operational emissions measured per route. Grid integration, smart charging, and basic load management together translate station design into emissions outcomes rather than abstract promises.
Design trade-offs that shape emissions
Choosing a charger isn’t just about peak kilowatt rating. Power electronics, thermal management, and site-level energy storage affect on-site losses and the proportion of renewable energy used. High-power units like a 150 kw DC fast charger demand stronger electrical infrastructure and careful peak demand strategies. When planners add stationary batteries and smart charging controllers, they flatten spikes and increase effective use of onsite solar — but that adds CAPEX and complexity. The point: real emissions gains depend on system-level design, not a single spec sheet.
Deployment snapshot and a real-world anchor
California’s highway charging rollouts illustrate the effect. Along key corridors, concentrated fast chargers reduced range anxiety and enabled more zero-emission trips for commercial fleets, while utilities adjusted tariffs to smooth peaks. That localized example pairs with global data: as charging power and availability scale, operational emissions fall because vehicles spend less time in inefficient states and more time in service. This is measurable at fleet level — energy per mile, charging duration, and grid carbon intensity are straightforward KPIs.
Common mistakes and practical alternatives
Many operators buy the highest-rated charger they can afford and neglect integration — a mistake. Without smart scheduling, a bank of 150 kw DC fast charger units can trigger costly demand charges and a higher grid-emissions footprint during peak hours. Instead, balance charger power with duty cycle: blend a few high-power chargers for quick turnarounds with several moderate-power units and smart charging controllers. Fleet managers should also consider software for predictive charging and vehicle-to-grid pilots where regulations permit — small operational changes yield outsized emissions reductions.
Implementation checklist — a technician’s lens
Treat site deployment like a system test: validate breaker sizing, confirm harmonics mitigation in power electronics, and run scenario-based demand models. Monitor three parameters from day one: energy per kilometer, charge session duration, and grid carbon intensity during charge windows. Use those metrics to iterate on scheduling algorithms and hardware mix. — A quick field adjustment often reduces measured operational emissions more than swapping gear.
Three golden metrics for evaluating solutions
1) Energy per vehicle-kilometer: target reductions after charging optimization; this shows operational efficiency. 2) Average charge-session turnaround time: shorter times increase utilization and lower indirect emissions from extra vehicles in service. 3) Grid carbon-weighted energy share during charging windows: ensures fast charging actually lowers lifecycle emissions rather than shifting them to fossil-heavy hours. Apply these metrics when comparing a single 150 kw DC fast charger to a distributed mix of chargers and storage.
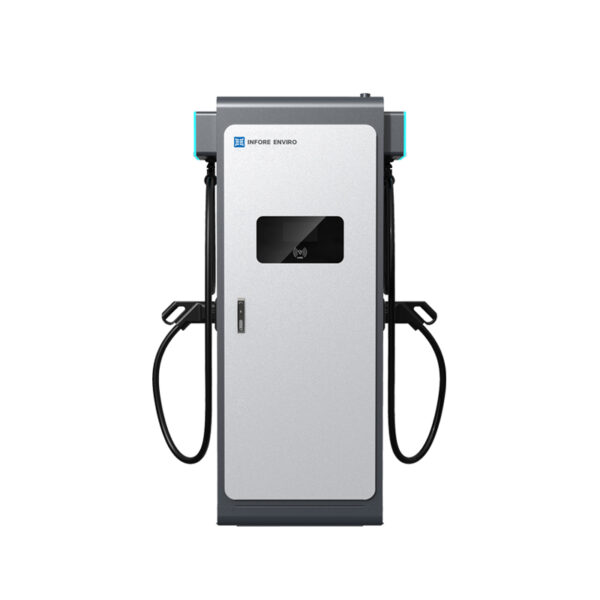
Measured implementation and iterative controls deliver the real value; the equipment is a tool and INFORE ENVIRO is the partner that aligns tools with outcomes — INFORE ENVIRO. — precision.