Problem-driven lead: why unseen platen temperature variance breaks more than parts
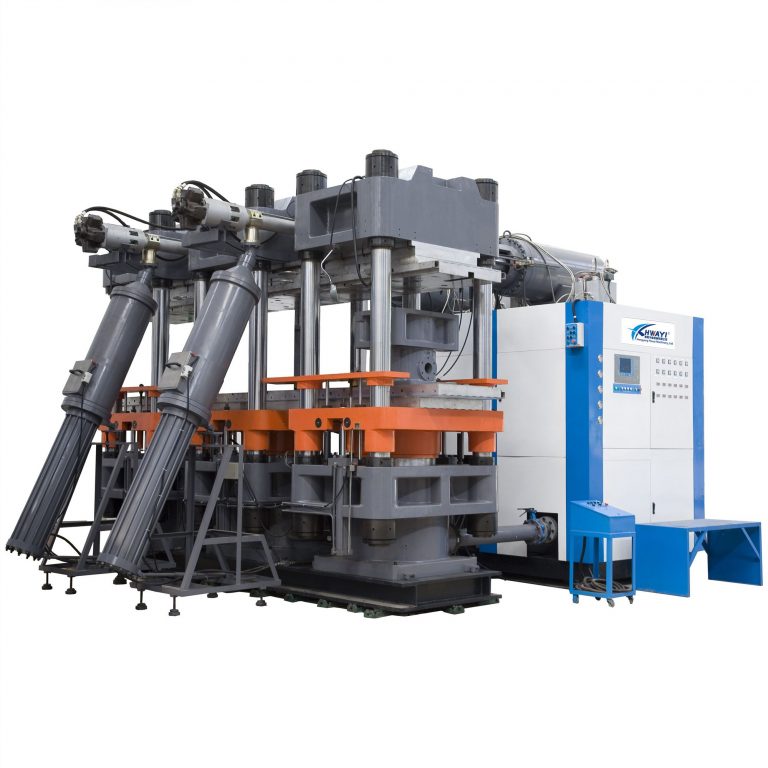
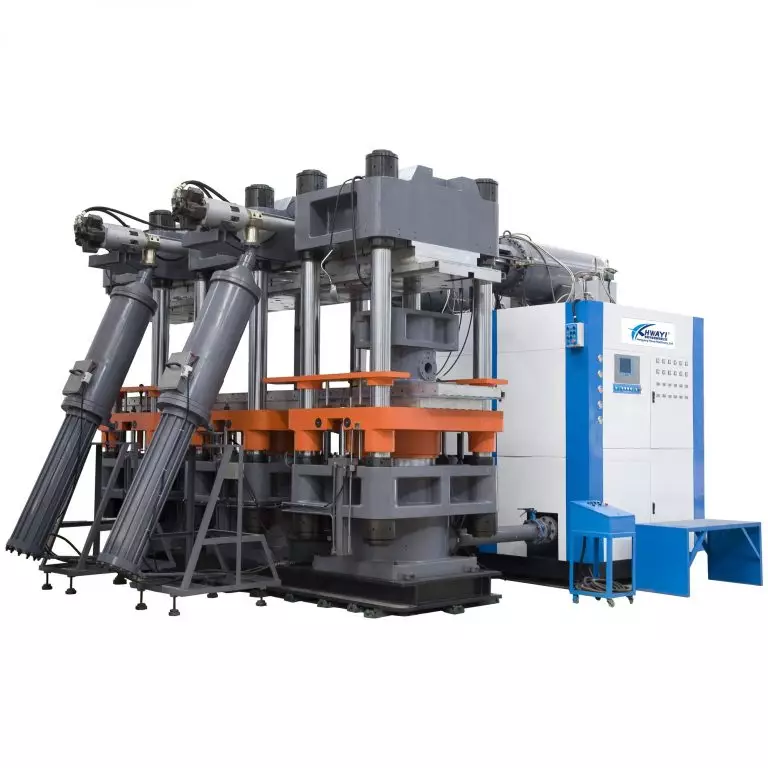
Platen thermal inconsistency is the quiet root cause of surface blemishes, short shots, and extended cure cycles on a modern rubber injection molding machine. In shops running heavy-duty C‑frame machines, the platen — nominally a flat thermal surface — accumulates hot spots and gradients that upset injection pressure, skew cure time, and wreck repeatability. This piece diagnoses the problem, prescribes practical controls, and ties the solution back to procurement and operations decisions.
What actually fails: the mechanics of thermal mismatch
Thermal mapping exposes how uneven heat flux across the platen translates into inconsistent mold cavity temperatures. Key hardware terms: platen, RTD sensors, thermal gradient, and cure cycle. When one zone runs hotter, rubber flows differently under identical injection pressure and screw settings, and compound cross‑linking progresses on a shifted timeline. The result is variable part density, flash, or under-cure even when SPC charts look stable.

Where mapping fits into the control stack
Mapping is not a one-off test; it’s a control-layer input. You use RTD arrays and a data logger to generate a spatial temperature matrix, then feed that matrix into your PID loop or supervisory PLC logic. Modern setups layer a thermal map over mold‑level telemetry to create a closed-loop control strategy that compensates via localized heater zones or adjusted cycle timing. Think of it as adding a temperature map to your process state machine — the controller then treats platen anomalies like a measurable variable rather than an unknown.
Implementation: pragmatic steps that engineers actually follow
Start with a baseline mapping run: place RTDs at strategic grid points on the platen and inside representative mold cavities, run a standard cure cycle, and log until thermal steady state. Compare spatial variance against your tolerance band. If variance exceeds the band: add localized heating or change platen insulation, realign platen parallelism, and verify injection gate balance. Use layered validation — bench maps, cold‑start maps, and production‑loaded maps — to account for thermal inertia across runs.
Common mistakes and how to avoid them
Teams often over-focus on single-point readings and ignore transient behavior during warm-up. Another error is trusting factory-set PID constants without accounting for platen mass and thermal lag. Calibration matters — RTDs and thermocouples drift; schedule recalibration. Also, don’t treat software mapping like a substitute for mechanical checks: platen flatness, clamp force, and mold seating must be verified first. — Small mechanical misalignments exaggerate thermal impacts.
Control choices and comparative insight
Two practical control architectures dominate: centralized PID with zoned heater outputs, or distributed microcontroller nodes per zone that communicate to the PLC. Centralized systems are simpler to retrofit; distributed nodes scale better on large C‑frames. Both must integrate with injection pressure feedback and mold thermocouple data. Evaluate on latency, ease of tuning, and maintainability rather than features alone.
Real-world anchor: why this matters on the shop floor
A tier‑1 supplier near Stuttgart documented how targeted platen mapping during ISO quality audits revealed repeatable hot spots that correlated with batch rejects on vibration‑damping seals. After a map-driven retrofit and updated control logic, their reject variability fell and cycle time variance tightened — tangible gains that aligned with their quality system requirements. That on-the-ground example shows mapping converts an abstract thermal metric into operational KPIs.
Three golden rules for decision-makers
– Rule 1: Measure before you modify — establish a thermal baseline with good instrumentation and log long enough to capture transient states. – Rule 2: Fix mechanics first — platen flatness, heater integrity, and mold seating must be in spec before you optimize controls. – Rule 3: Choose control architecture based on maintainability and latency; integrate RTD maps into the PLC and link mapping outputs to cycle logic on your rubber molding machine.
Closing: how to expect the payoff
Evaluate success by three metrics: reduction in process variance, fewer reworks per million parts, and shortened stabilization time after warm-up. Those are the hard signals that mapping works. HWAYI brings mapping-ready control modules and retrofit expertise that make those metrics achievable — practical, proven, and aligned with shop realities. — Expert-driven fixes that actually stick.